Tracing
Tracing is a utility provided by this library to help diagnose and debug applications. Tracing allows you to wrap any function call with tracing information, including the inputs and outputs of the function, and any errors that occurred. This library provides the trace function to facilitate tracing in your application.
Usage
To use Tracing, you can import the trace function from the tracing module:
import {
  trace,
  setTraceConfig,
  graphTraces,
  sendTraceToServer,
} from "@promptable/promptable";
To trace a function, simply wrap it with the trace function:
const tracedFunction = trace("functionName", originalFunction);
Now, when you call tracedFunction, it will log the inputs, outputs, and any errors that occurred.
You can also set the tracing configuration using the setTraceConfig function. By default, tracing information is sent to the console. To send tracing information to a server, set the serverUrl and send properties:
setTraceConfig({
  serverUrl: "https://example.com/traces",
  send: sendTraceToServer,
});
The send function is called with each trace, and should send the trace to a server for storage and analysis.
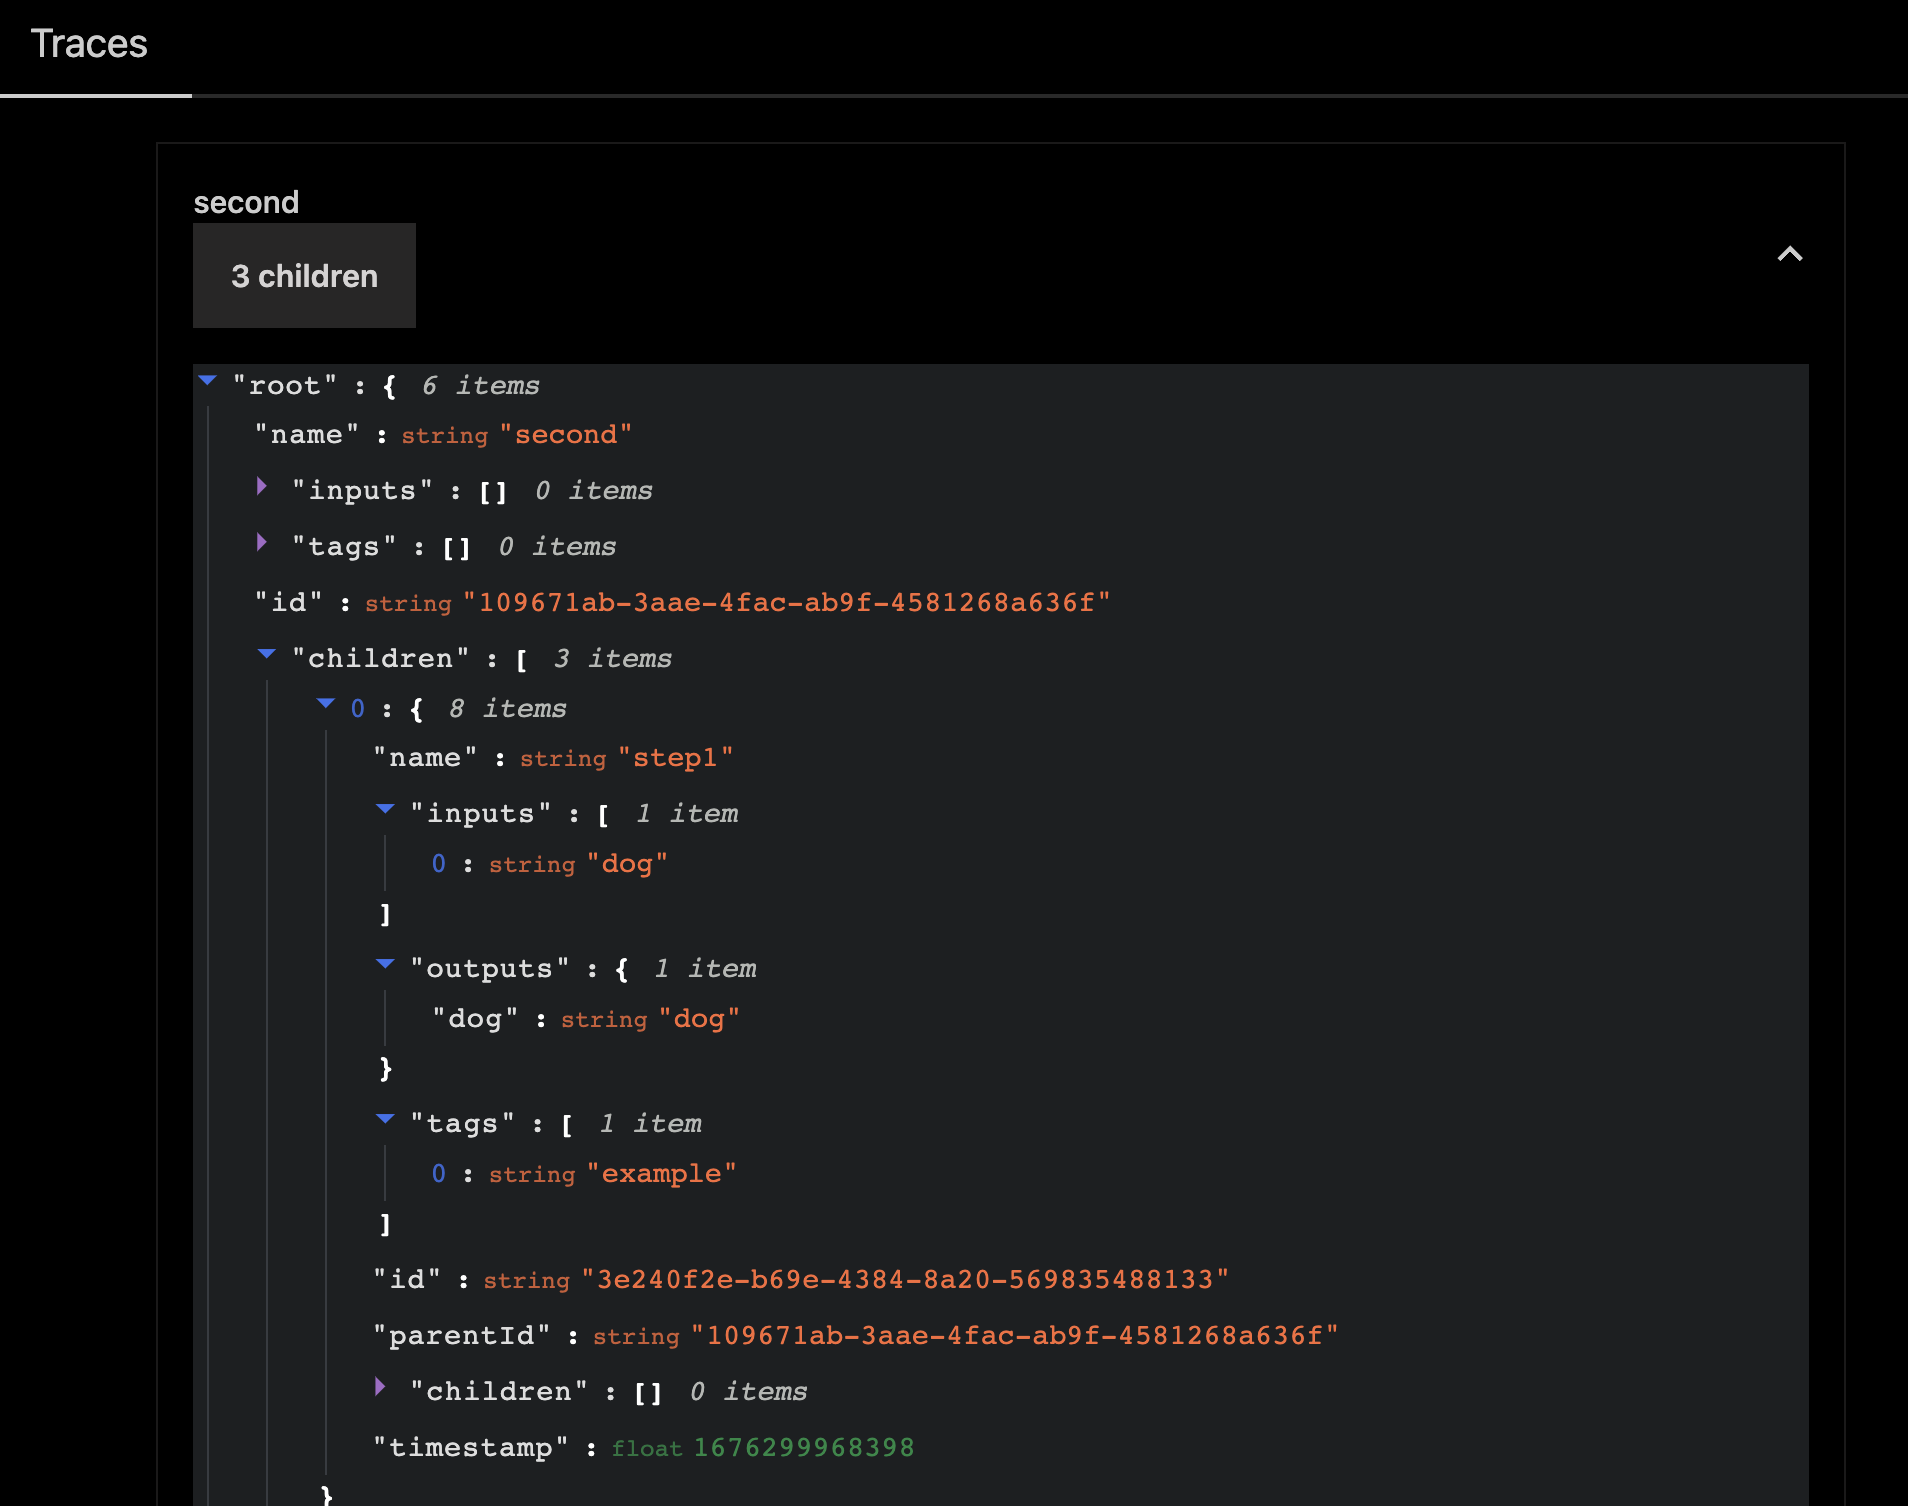
Finally, you can use the graphTraces function to display a visual representation of your traces. This can be useful for understanding the flow of your application and identifying performance bottlenecks:
const trace = tracedFunction(args);
graphTraces([trace]);
This will output a tree of the traces, starting with the root trace.
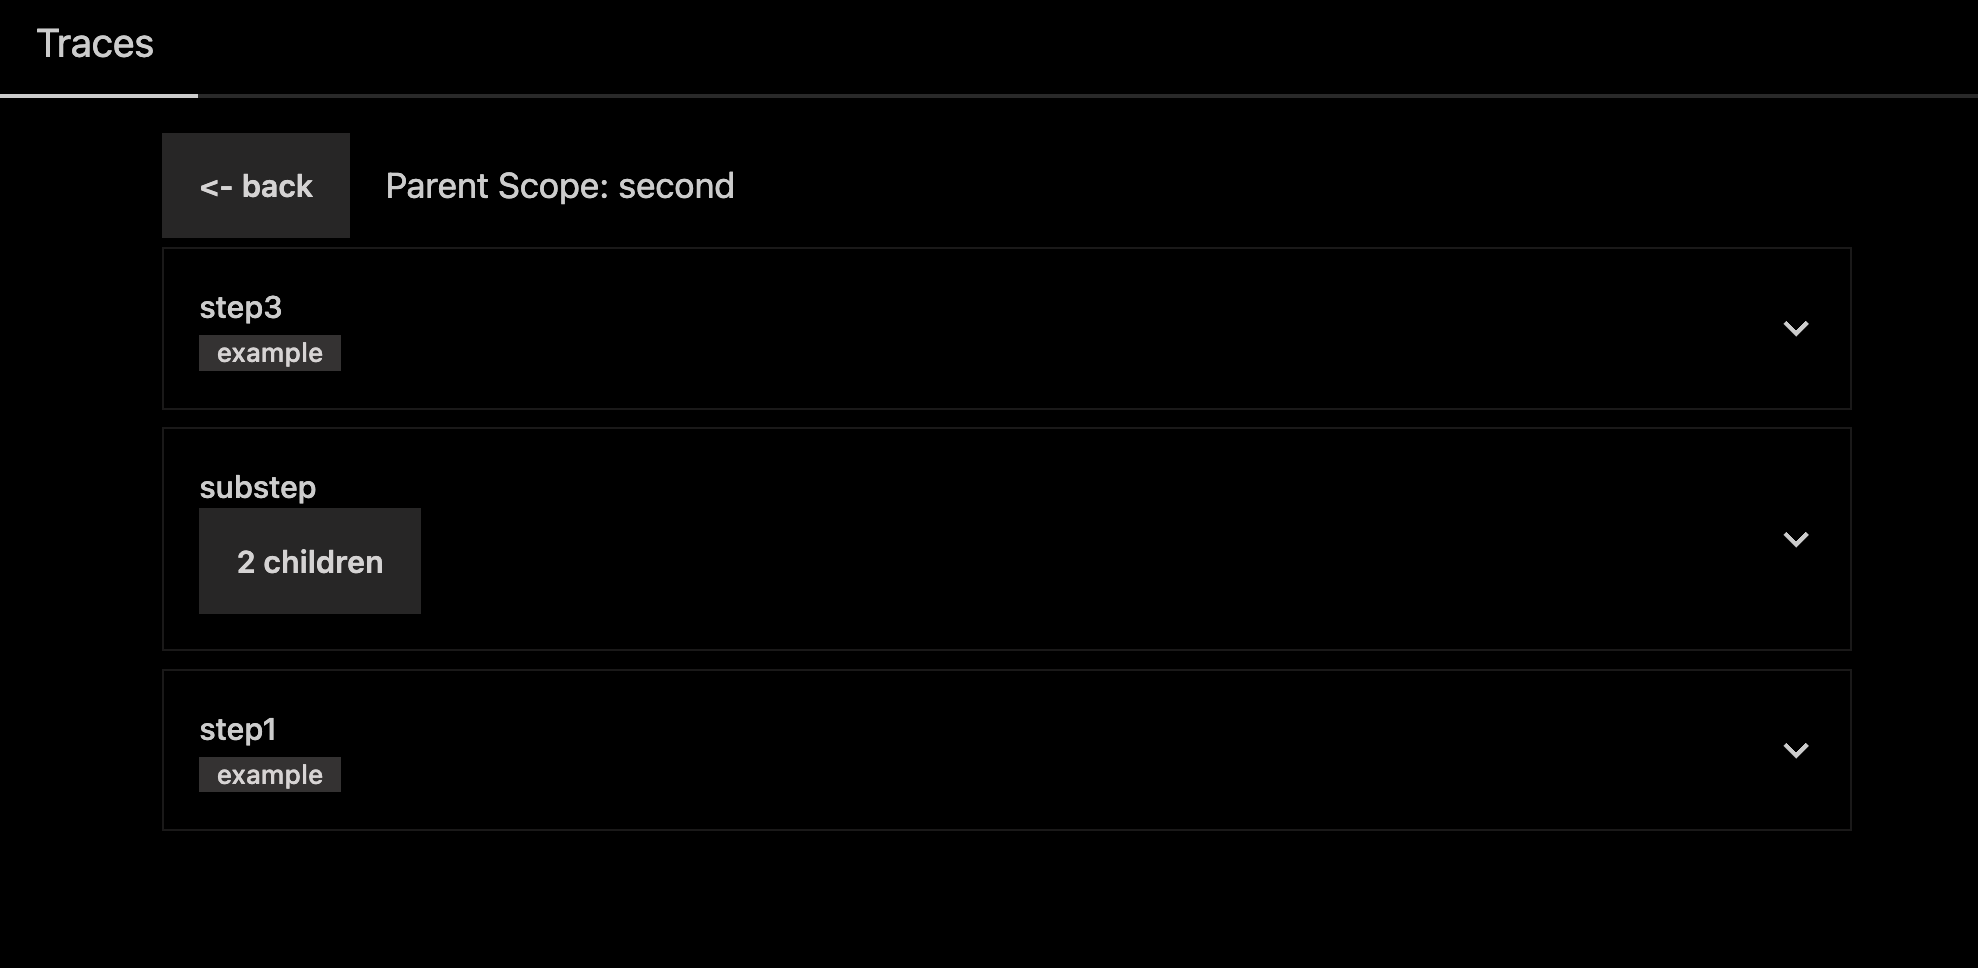
Sending Traces to Web UI
Promptable also provides a web ui for viewing traces. To use it, you can import the trace function from the tracing module:
The code for the ui is located in the apps/web directory. To run it, you can run the following command:
pnpm run dev --filter web
To configure a different trace server, you can set the serverUrl property of the tracing configuration:
setTraceConfig({
  serverUrl: "https://localhost:3000/api/traces",
  send: sendTraceToServer,
});
Tracing UI